Can we teach a machine to be a cardiologist? 2021
Supervisors
Honours students
Project guidelines
Project description
Electrocardiograms (ECGs) are an important biological signal. They are a measurement of the electrical activity of the heart and can be used to diagnose a number of cardiovascular diseases (CVD). Machine learning (ML) techniques can be used to identify the important features of an ECG and then classify these into normal and abnormal groups. In this project, ECG recordings were collected from the PhysioNet Database[1], and have been classified using existing ML techniques.
As engineers, we frequently work with a range of signals and signal processing techniques. These signals may come from anywhere, including electrical equipment, or the human body. Often signals collected from the human body are used to measure or verify a patient's health. One example of a biological signal which is of interest is the electrocardiogram (ECG), which are signals are collected by placing electrodes on the skin around the heart. Any abnormalities in the signal may be an indication of a cardiovascular disease (CVD). CVD affects around 1/6 Australians and contributes to 26% of deaths[2], so the early detection and treatment of these are critical.
There has been a recent interest in using machine learning (ML) techniques to identify features of, and then classify, ECG signals. ML techniques could make it possible to diagnose patient more precisely than when done manually[3]. In this project, we explored various methods of classifying ECGs, and pre-processing methods to improve this.
In this project we aimed to:
- Investigate whether machine learning can be used to teach a computer to accurately distinguish between normal and abnormal heart patterns;
- Extend this to distinguishing between different heart diseases; and,
- Find a reasonably good method to do this.
Background and Relevant Work
Electrocardiograms

ECGs represent the electrical activity of the heart with respect to time. In the human body, the contraction of muscles is associated with changes in the membrane potential (i.e. depolarisation) of cells[5]. In this way, ECGs can be acquired by placing electrodes on the body (either on the torso or the limbs), and measuring the potential difference between these. The important features in a single cycle of an ECG are shown in Figure 2.1. In particular the P wave, T wave and QRS complex, as well as time between subsequent R peaks, are of interest, since any irregularity or absence in any of these features could indicate an abnormality. The P-wave corresponds to the contraction of the two smaller chambers of the heart (the atria), whereas the QRS complex corresponds to the contraction of the two larger chambers (the ventricles) which push blood out of the heart and around the body. The T-wave represents the repolarisation of the ventricles, although the repolarisation of the atria is not visible as it coincides with the QRS complex. The RR interval represents the length of time between subsequent heart beats, so can quickly identify whether a patients' heart is beating in a regular rhythm. ECG acquisition was beyond the scope of this project. Instead, all data was collected from the PhysioNet Database[1].
Classifying ECGs is a challenging process for a number of reasons. For example, normal ECGs differ between patients, one disease may have dissimilar signs on different patients, and two distinct diseases may have a similar effect on the ECG[3]. Furthermore, electrodes pick up not only activity of the heart, but other muscular contractions. As such, artefacts (for example from motion or breathing) and noise, are often overlaid on the ECG as well. This can make it harder for a physician to distinguish, hence, pre-processing and machine learning classification of ECGs may be able to diagnose patients more precisely.
Cardiovascular Disease

Cardiovascular disease (CVD) is a term that includes heart, stroke, and other blood vessel diseases. It is among Australia's largest health problems, and accounts for around one in four of all deaths. Most CVD risk factors are able to be prevented through a healthy lifestyle[2], so it is important that CVDs are identified as early and accurately as possible.
CVD can come in many forms, although for this project just atrial fibrillation (AF) was considered. AF is an abnormal heart condition in which the regular atrial activity is instead replaced with fast and disorderly tremor waves[6]. On the ECG, this means the P-waves often disappear, and the RR interval has a variable duration. The incidence of AF increases with age, and is characterised by palpitations, shortness of breath and chest pain.
ECG Analysis Steps
The steps required to analyse and classify ECG waveforms include the following four steps: pre-processing, feature extraction and selection, classification, and validation. This section will describe what each of these steps entails, and list techniques which can be used at each stage. Deep learning analysis of ECG waveforms is by no means a new field of work, so the methods and results produced by a number of previous studies were able to be examined. This section also quickly discusses the processes and results found in the literature.
Pre-processing
Prior to analysing the signal, it is often useful to complete some pre-processing to remove undesirable features including noise, baseline wander, motion artefacts and other interruptions. It is almost always useful to remove noise, and this can be completed with ordinary high-pass, low-pass and band-pass filters, or with wavelet denoising. For example, Wang et al.[7] used a number of different filters to pre-process ECG recordings. They used a 50Hz notch filter to remove powerline interference, a 30Hz low-pass filter to remove high frequency noise, and a 0.1Hz high-pass filter to remove low-frequency noise and artefacts (such as breathing artefacts). Similarly Hu et al.[6] used a bandpass filter with cut-off frequencies at 0.5Hz and 30Hz, for the same reasons.
Wavelet denoising works in quite a different manner. Instead, wavelet decomposition is used on the signal, and a certain threshold is used to concentrate the signal over only a few wavelet coefficients[8]. Wavelet denoising can have the advantage over traditional filtering as particular types of wavelets are similar in shape to the ECG features. Another advantage of using wavelets, is that the wavelet transform gives a time-variant decomposition, making it possible to choose different filtering settings for different time windows.
Other pre-processing steps can also be applied. For example, the ECG could be transformed using the Moment of Velocity (MoV)[9]. The MoV of a signal is similar to its instantaneous frequency, however it is more robust to noise and can suppress large spikes caused by sudden changes. Hence, it is able to provide spectral information in a more convenient way.
Feature Extraction and Selection
In general, machine learning works by classifying data based on a number of features in that data. It is usually quicker and more accurate to do this based on a small set of features instead of the raw data, hence it is critical to extract an appropriate set of features. For example, if we were classifying different types of fruit we might choose features such as colour and shape to distinguish between them. The features required to classify ECG signals are more abstract, but the principle is the same. Features which are consistent within a class, but which vary between classes are desirable.
Features can come from the time domain, frequency domain, or even the time-frequency domain. In the time domain, features can include the detection of R-peaks and hence RR-intervals, the shape of the QRS complex, or the duration of the P-wave and other intervals. Often variation within a given ECG, particularly variation of the RR-interval, is indicative of an abnormality[6]. One method of extracting the QRS complex discussed in the literature was a process called the Pan-Tompkins algorithm[3][10]. This process involves filtering and differentiating the ECG to remove noise and low-frequency components, squaring the signal to enhance high-frequency components, and finally using a moving-window integrator to extract the slope of the R-waves. Each stage of this algorithm is shown below in Figure 2.4, and the result overlaid on an ECG is shown in Figure 2.5.
Conversely, features can come from the frequency domain. The main features in an ECG signal are contained within a frequency range of about 0.5-30 Hz [6][7], with components outside this range largely corresponding to noise. Hu et al.[6] demonstrated that the frequency component with the maximum amplitude may be important to identify. In normal signals, this is around 1 Hz, but is more volatile in patients with AF, where it can range from 2 to 8 Hz. However, ECG signals are non-stationary data, meaning their properties can't be fully described with frequency domain information. This is where time-frequency features come in.
Time-frequency features demonstrate how the frequency content of a non-stationary signal varies with time. One such tool for time-frequency analysis is a scalogram. The scalogram is displayed as an image, which can be used for classification by a CNN. Figure 2.6 shows a scalogram for a normal ECG pattern, and Figure 2.7 shows a scalogram for a patient with AF. Another time-frequency feature extraction technique which can be used is that of the wavelet decomposition. Similar to decomposing a signal into a sum of sinusoids in Fourier analysis, wavelet decomposition decomposes the signal into a sum of wavelets[11]. The idea of wavelet decomposition is to reduce a large signal (for example 9000 samples long) to a shorter set of features (e.g. 190). This can significantly decrease computational time while increasing performance.
-
 Figure 2.4: Stages of the Pan-Tompkins Algorithm.
 -
 Figure 2.5: Comparison of ECG and extracted QRS using Pan-Tompkins.
 -
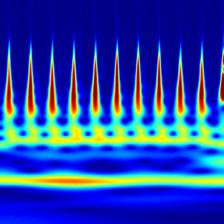 Figure 2.6: Scalogram of Normal ECG.
 -
 Figure 2.7: Scalogram of ECG with AF.


Classification and Validation
ECG classification is a multi-class classification problem[3], including classes such as normal and abnormal, and possibly even separating the abnormal class into specific conditions. Classification can be completed using many different methods. In this project, the classification step has made use of a number of machine learning (ML) techniques. ML is an application of artificial intelligence in which algorithms parse data, learn which feature corresponds to which class, and then apply this to make an informed decision on new data.
In order to train the machine, the data is split into a "training set" and a "test set". First, the training set and its correct labels are given to the machine to teach it how to identify each class in the data. Depending on the ML, this may make clusters of each class, or assign weights to a neural network, for example. Next, the ML is used to classify the test set of data. The effectiveness of the method is then validated by comparing the assigned classes to the actual classes for all the data in the test set.
A number of ML algorithms are of interest, including the support vector machine (SVM), convolutional neural network (CNN) and recurrent neural network with long-short term memory (LSTM). Each of these are described briefly following.

Support Vector Machine
An SVM is a supervised machine learning algorithm which can be used to classify data based on the value of a number of features. Each signal in the training set is plotted in n-dimensional space (where 'n' is the number of features), then a line (or hyperplane in higher-order space) is drawn between the clusters of each category to best separate the data. The signals in the test set of data are then plotted in the same n-dimensional space, and are assigned a class based on the location in which it falls. Figure 2.10 shows a simple 2-dimensional example with Class 1 in red and Class 2 in blue. If a new data point, as shown by the green dot in Figure 2.10, is introduced, the SVM will classify this as a Class 2, given the side it falls on.
Many previous studies have made use of an SVM to classify ECG data[13][14][15]. Venkatesan et al.[15] achieved a 96% accuracy for sorting normal and abnormal ECG signals based on a range of time- and frequency-domain features. Zhang et al.[14] tested a range of SVMs, and found a least-squares SVM to be more effective than the others, achieving an accuracy of over 92%. Li et al.[13] extended the idea of SVM classification by experimenting with ways in which it could be optimised. Among others, they found particle swarm algorithms and genetic algorithms to be effective, achieving an accuracy of over 95% in each case.
Convolutional Neural Network
An artificial neural network (ANN) is capable of extracting complex and non-linear sets of features from a set of data. They are constructed to simulate neurons in the biological nervous system, and so are composed of many interconnected units linked with various weighting factors. The weight of each determines its contribution and can be adjusted through training. The general structure of an ANN is shown in Figure 2.11.
Building on from ANNs, CNNs add processing stages to the input of the neural network. The convolution layers extract features from the input data, and the pooling layers reduce the size of these features, which decreases the computational power of data classification. Finally, a fully-connected layer is used to classify the data, and this is usually a regular ANN. CNNs are particularly useful for classifying images, for example hand-written numbers as in the diagram in Figure 2.12.
CNNs are a well-tested means of classifying ECG signals[16][17][18]. Huang et al.[16] reported a 99% accuracy when using a 2D-CNN, but only a 90% accuracy for the 1D-CNN, demonstrating the power of classification based on spectral data. Similarly, Rashed-Al-Mahufuz et al.[17] classified scalogram images using a VGG16 architecture, a type of CNN with 16 layers. This method had close to 100% accuracy when distinguishing between both four or six classes of heart condition. Finally, Lih et al.[18] made use of an LSTM model along with the CNN to improve their results. Even with noisy signals, this was able to achieve high accuracy (97.33%), although it was time-consuming and required a sizeable amount of data. Furthermore, it was recommended that a pre-trained model with high performance at a related task could be used to reduce computational complexity[17]. Parts of the classifier can then be modified as needed to improve its performance for the new task.
Long-Short Term Memory
An LSTM network is a type of recurrent neural network (RNN) which is well-suited to classifying time-series data. They are an improvement over traditional RNNs which suffer from short-term memory, and hence have a tendency to "forget" what was seen earlier in longer sequences[19]. LSTM networks have the ability to keep or forget information as training progresses, enabling them to effectively analyse long sequences of data by retaining only the important information. The structure of an LSTM unit is shown in Figure 2.13.
LSTM networks have been used to successfully classify ECG arrhythmias[20][21][22]. Hou et al.[20] used an LSTM network with an SVM to classify between 5 classes of ECGs with sensitivities and specificities above 95%. Saadatnejad et al.[21] proposed an LSTM classifier for wearable cardiac monitoring. Their algorithm was found to be both accurate and less computationally intensive than other deep learning approaches. Yildirim[22] developed a novel approach using a bidirectional LSTM network and wavelet sequence to classify ECG signals, and reported a high recognition performance of 99.25%.
-
![Figure 2.11: Example ANN structure.[23]](/personal/dabbott/wiki/images/d/d9/ANN_example.png) Figure 2.11: Example ANN structure.[23]
Figure 2.11: Example ANN structure.[23] -
![Figure 2.12: Example CNN structure, for identifying hand-written numbers.[24]](/personal/dabbott/wiki/images/thumb/0/09/CNN_example.jpeg/561px-CNN_example.jpeg) Figure 2.12: Example CNN structure, for identifying hand-written numbers.[24]
Figure 2.12: Example CNN structure, for identifying hand-written numbers.[24] -
![Figure 2.13: LSTM Unit Structure.[20]](/personal/dabbott/wiki/images/thumb/6/69/LSTM_Structure.gif/351px-LSTM_Structure.gif) Figure 2.13: LSTM Unit Structure.[20]
Figure 2.13: LSTM Unit Structure.[20]
![Figure 2.11: Example ANN structure.[23]](/personal/dabbott/wiki/index.php/File:ANN_example.png)
![Figure 2.12: Example CNN structure, for identifying hand-written numbers.[24]](/personal/dabbott/wiki/index.php/File:CNN_example.jpeg)
![Figure 2.13: LSTM Unit Structure.[20]](/personal/dabbott/wiki/index.php/File:LSTM_Structure.gif)
The result of each combination of denoising techniques, selected features, and classifiers were fully documented in the Final Report, 2021.
Approach and methodology
In completing this project, we investigated the effect of a range of different pre-processing techniques and classification algorithms on classifying the same set of data. Figure 3.1 describes the flow chart to identify AF between normal signals, starting from data preparation to pre-processing, feature-engineering, ending with classification performance. There is a loop from filtering signals to classification assessment since various machine learning techniques were investigated, as well as the most appropriate denoising method for AF detection.

Result and Conclusion
-
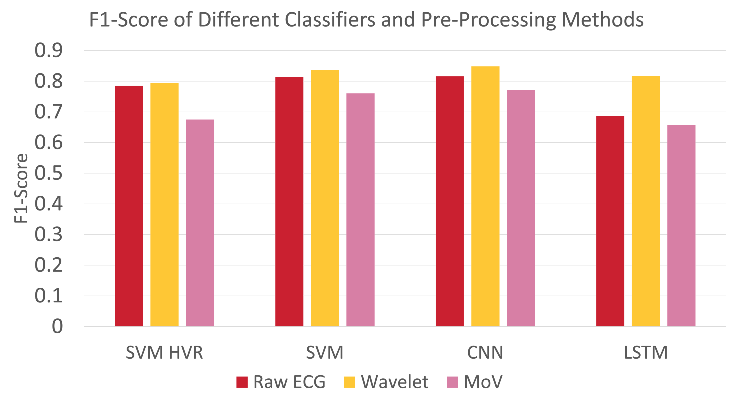 Figure 4.2: Comparison of Results for each Technique.
 -
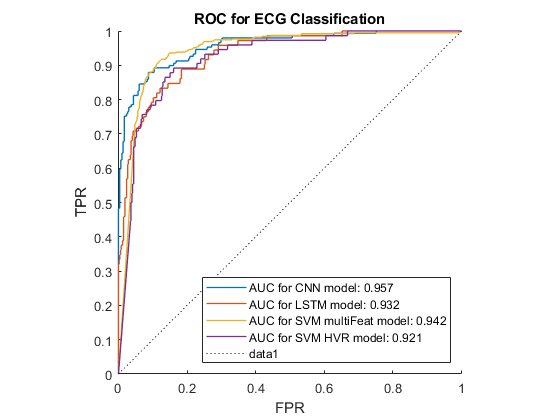 Figure 4.3: Robustness comparison between various classifiers.


So, can we teach a machine to be a cardiologist? The short answer is yes. In terms of teaching a machine to accurately recognise different heart conditions by analysing the ECG recording of patients, this is entirely possible, as our results have shown. It is also worth mentioning that results in the literature have achieved higher results than ours, so with a deeper understanding and more fine-tuning, a highly reliable model can be created.
Future work could be done to improve classification performance. This could be done by modifying the combination of pre-processing, feature extraction and classification to find the optimal solution, or by finding different methods of each of these processes which is better suited to the data. Our model was designed to identify AF from normal and other abnormal conditions, but the classifier could be extended to identify a greater range of cardiovascular conditions.
The detailed result of each combination of denoising techniques, selected features, and classifiers were fully documented in the Final Report, 2021.
Deliverables
Semester A
- Proposal seminar (12 April)
- Interim Thesis (Sonia)
- Interim Thesis (Long)
Semester B
- Final seminar (2 November )
- Final report - only one report needed in wiki format (29 October)
- Project exhibition Poster - one poster only needed (5 October)
- YouTube video:
- Ingenuity Poster:
- Final Thesis (Sonia)
- Final Thesis (Long)
See also
References and useful resources
- ↑ 1.0 1.1 PhysioNet, Available: https://physionet.org/content/challenge-2017/1.0.0/
- ↑ 2.0 2.1 2.2 Heart Foundation, Available: https://www.heartfoundation.org.au/activities-finding-or-opinion/key-stats-cardiovascular-disease
- ↑ 3.0 3.1 3.2 3.3 S. H. Jambukia, V. K. Dabhi, H. B. Prajapati; Classification of ECG signals using machine learning techniques: A survey; IEEE, 2015; Accessed: 16 March 2021; [Online] DOI: 10.1109/ICACEA.2015.7164783
- ↑ ResearchGate, ECG Schematic, Available: https://www.researchgate.net/figure/Schematic-representation-of-normal-ECG-waveform_fig3_287200946
- ↑ P.S. Addison, Wavelet Transforms and the ECG: a Review, in Physiological Measurement, vol. 26, 2005; [Online], Available: https://iopscience.iop.org/article/10.1088/0967-3334/26/5/R01/pdf
- ↑ 6.0 6.1 6.2 6.3 6.4 Y. Hu, Y. Zhao, J. Liu, J. Pang, C. Zhang, P. Li, An Effective Frequency-Domain Feature of Atrial Fibrillation Based on Time-Frequency Analysis, in BMC Medical Informatics and Decision Making, vol. 20, 2020; [Online], Available: https://link.springer.com/article/10.1186/s12911-020-01337-1
- ↑ 7.0 7.1 J. Wang, P. Wang, S. Wang, Automated Detection of Atrial Fibrillation in ECG Signals Based on Wavelet Packet Transform and Correlation Function of Random Process, in Biomedical Signal Processing and Control, vol. 55, 2020; [Online]. Available: https://www.sciencedirect.com/science/article/pii/S1746809419302435
- ↑ O. Faust, U.R. Acharya, H. Adeli, A. Adeli; 2015, Wavelet-Based EEG Processing for Computer-Aided Seizure Detection and Epilepsy Diagnosis, in Seizure, vol. 26, 2015, pp 56-64; [Online], Available: https://www.sciencedirect.com/science/article/pii/S1059131115000138
- ↑ M. Dorraki, A. Fouladzadeh, A. Allison, B.R. Davis and D. Abbott; On moment of velocity for signal analysis, in Royal Society Open Science, vol. 6, issue 3, 2019, Available: https://royalsocietypublishing.org/doi/full/10.1098/rsos.182001
- ↑ Y. Palaniappan, V.A. Vishanth, N. Santhosh, R. Karthika, M. Ganesan; 2020, R-Peak Detection Using Altered Pan-Tompkins Algorithm, IEEE, 2020; [Online]. Available: https://ieeexplore.ieee.org/abstract/document/9182298
- ↑ N. Emanet, ECG Beat Classification by Using Discrete Wavelet Transform and Random Forest Algorithm, IEEE, 2009, [Online]. DOI: 10.1109/ICSCCW.2009.5379457
- ↑ R. Gholami, N. Fakhari, Support Vector Machine: Principles, Parameters, and Applications, in Handbook of Neural Computation, 2017, pp 515-535; [Online], Available: https://www.sciencedirect.com/science/article/pii/B9780128113189000272
- ↑ 13.0 13.1 H. Li, et al., Arrhythmia Classification Algorithm Based on Multi-Feature and Multi-Type Optimised SVM, in the American Scientific Research Journal for Engineering, Technology and Sciences (ASRJETS), vol. 63, No 1, 2020, pp 72-86; [Online]. Available: https://asrjetsjournal.org/index.php/American_Scientific_Journal/article/view/5509/2046
- ↑ 14.0 14.1 Y. Zhang, S. Wei, L. Zhang, C. Liu, Comparing the Performance of Random Forest, SVM and Their Variants for ECG Quality Assessment Combined with Nonlinear Features, in Journal of Medical and Biological Engineering, vol. 39, 2019, pp 381-392. [Online], Available: https://link.springer.com/article/10.1007/s40846-018-0411-0
- ↑ 15.0 15.1 C. Venkatesan, et al.; ECG Signal Preprocessing and SVM Classifier-Based Abnormality Detection in Remote Healthcare Applications; IEEE, 2018; Accessed 20 March 2021; [Online] DOI: 10.1109/ACCESS.2018.2794346
- ↑ 16.0 16.1 J. Huang, B. Chen, B. Yao, W. He, ECG Arrhythmia Classification Using STFT-Based Spectrogram and Convolutional Neural Networks, in IEEE Access, vol. 7, 2019; [Online]. Available: https://ieeexplore.ieee.org/document/8759878
- ↑ 17.0 17.1 17.2 M. Rashed-Al-Mahfuz, M.A. Moni, P. Lio, S.M.S. Islam, S. Berkovsky, M. Khushi, J.M.W. Quinn, Deep Convolutional Neural Networks Based ECG Beats Classification to Diagnose Cardiovascular Conditions, in Biomedical Engineering Letters, vol 11, 2021, pp 147-162; [Online], Available: https://link.springer.com/article/10.1007/s13534-021-00185-w
- ↑ 18.0 18.1 O.S. Lih, et al., Comprehensive Electrocardiographic Diagnosis Based on Deep Learning, in Artificial Intelligence in Medicine, vol. 103, 2020; [Online]. Available: https://www.sciencedirect.com/science/article/pii/S0933365719309030
- ↑ M. Phi; 2018; Illustrated Guide to LSTM’s and GRU’s: A step by step explanation; [Online], Available: https://towardsdatascience.com/illustrated-guide-to-lstms-and-gru-s-a-step-by-step-explanation-44e9eb85bf21
- ↑ 20.0 20.1 20.2 B. Hou, J. Yang, P. Wang, R. Yan, LSTM-Based Auto-Encoder Model for ECG Arrythmias Classification, in IEEE Transactions on Instrumentation and Measurement, vol. 69, issue 4, 2020, [Online], DOI: 10.1109/TIM.2019.2910342
- ↑ 21.0 21.1 S. Saadatnejad, M. Oveisi, M. Hashemi, LSTM-Based ECG Classification for Continuous Monitoring on Personal Wearable Devices, in IEEE Journal of Biomedical and Health Informatics, vol. 24, issue 2, 2020, [Online], DOI: 10.1109/JBHI.2019.2911367
- ↑ 22.0 22.1 O. Yildirim, A novel wavelet sequence based on deep bidirectional LSTM network model for ECG signal classification, in Computers in Biology and Medicien, vol. 96, pp 189-202, 2018, [Online], Available: https://doi.org/10.1016/j.compbiomed.2018.03.016
- ↑ L. Chang, Z. Zhang, L. Ye, D. Friedrich, Synergistic Effects of Nanoparticles and Traditional Tribofillers on Sliding Wear of Polymeric Hybrid Composites, in Tribology of Polymeric Nanocomposites, 2nd ed., 2013, pp 49-89; [Online], Available: https://www.sciencedirect.com/science/article/pii/B9780444594556000039
- ↑ S. Saha, A Comprehensive Guide to Convolutional Neural Networks – the ELI5 Way, 16 Dec 2018, Accessed: 24 May 2021, [Online], Available: https://towardsdatascience.com/a-comprehensive-guide-to-convolutional-neural-networks-the-eli5-way-3bd2b1164a53